From 4-Hour Delays to 8-Second Visibility: How One Manufacturer Eliminated $2.1M in Expedite Costs

Abitha Jeyaraj, Marketing Executive
November 5, 2026 · 6 min read
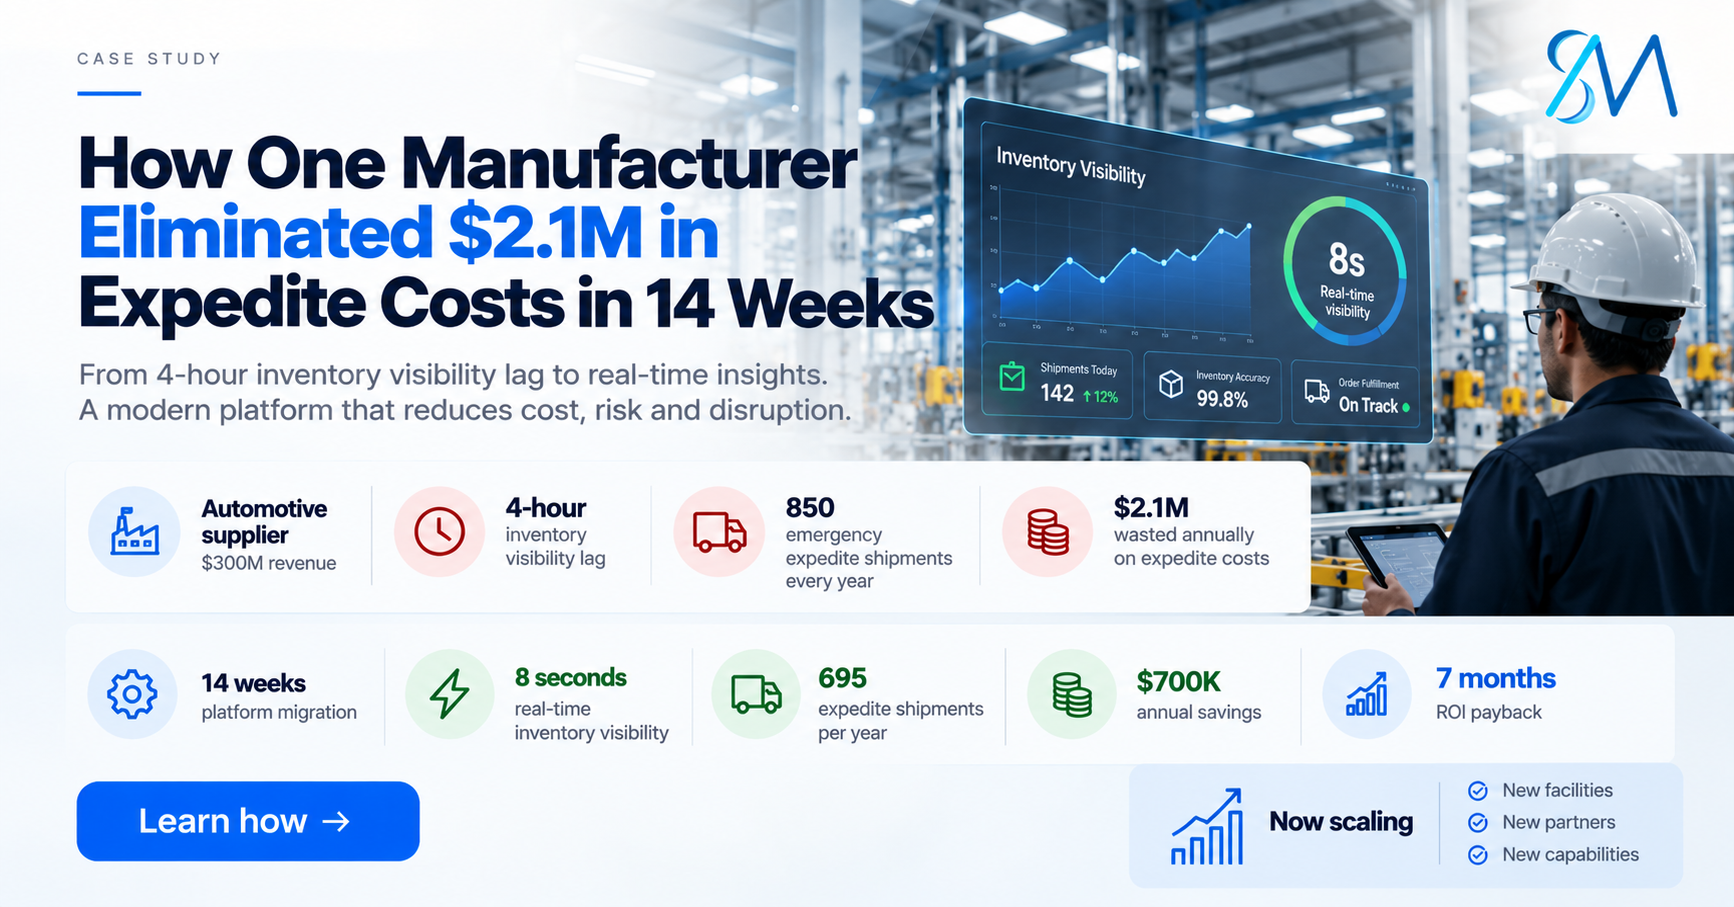
They had a problem nobody else was talking about.
Client: Automotive supplier, $300M annual revenue, 200+ supply chain partners
Problem: Inventory visibility was 4 hours delayed. In a just-in-time supply chain, that’s an eternity.
Result: 14 weeks later, real-time visibility. $2.1M in annual savings. ROI payback in 7 months.
The $2.1M Problem
Four years of operating with a legacy inventory platform meant one thing: decisions made on stale data.
Supply disruption at 9 AM? Discovery at 1 PM. By then, it cascades.
The client’s procurement team couldn’t forecast. Supply chain partners couldn’t trust the data. Expedited shipments became routine.
The cost:
| Metric | Amount |
|---|---|
| Average expedited shipments/year | 850 |
| Cost per expedite | $2,500-$3,000 |
| Annual expedite cost | $2.1M |
In context:
- Gross margin on their automotive parts: 12-18%
- So they were losing 3-4 full points of margin to expedite premiums
- Every dollar of expedite cost required $8-$12 of new revenue to offset
The board question: Why aren’t we fixing this?
Why They Stayed Stuck (For 4 Years)
Reason 1: Cost was invisible
Expedited shipments were handled by procurement. Nobody tied them to “legacy system.”
Manual inventory reconciliation was handled by operations. Nobody quantified the labor cost.
The data delay was part of muscle memory. Nobody calculated the impact.
So the CFO saw a $2.5M migration cost and said: “We don’t have budget for that.”
Reason 2: Migration risk felt real
“What if the new system breaks during cutover?” “What if we lose supply chain visibility for a week?” “What if customers can’t order?”
Valid concerns. But they needed an architecture partner who could lock the timeline and accountability.
Reason 3: Vendor story was “it’s stable”
Legacy system vendor: “System is performing fine. No urgent need to change.”
True. It was stable. But stable at a $2.1M/year cost.
The Decision
Board approved the migration. Not because the CFO suddenly had budget.
But because they calculated the cost of staying: $2.1M/year × 3 years = $6.3M.
Cost of fixing it: $1.45M.
Net savings: $4.85M over 3 years.
Payback on the investment: 7 months.
Decision: Approved.
The 14-Week Journey
Phase 1: Architecture (Weeks 1-2)
We deep-dived into their legacy system:
Where’s the 4-hour delay actually coming from?
Answer: Batch processing runs every 4 hours
What’s the impact on supply chain decisions?
Answer: Can’t react to disruptions in real-time
What workarounds has your team built?
Answer: 4 workarounds we discovered:
- Manual batch retry (2-3x daily, someone had to babysit)
- Cache layer for production schedules (system was slow; users built workarounds)
- Weekly reconciliation process (8 PM, every Friday, manual data integrity check)
- Custom board reports (annual, SQL queries, nobody documented)
If we’d missed any of these, go-live would have been a firefight.
Phase 2: Design & Integration (Weeks 3-8)
New architecture:
- Real-time event streaming (every inventory change published immediately)
- Explicit workaround handling (all 4 legacy workarounds now built into the platform)
- Supply chain partner integration (8 partners connected in parallel, live testing)
- Compliance validation (automotive supplier = strict tracking requirements)
Load testing:
- 50K+ SKUs
- 200+ supply chain partners
- Real production patterns (not benchmarks)
- 120% capacity testing (handle surge events)
Phase 3: Go-Live (Week 11)
Cutover planned for 6 hours (9 AM – 3 PM).
Actual: 6 hours.
Issues: Minimal (because we tested against their actual patterns, not benchmarks).
Inventory visibility: Switched from 4-hour batch updates to real-time (8 seconds).
Phase 4: Stabilization (Weeks 12-14)
Real production load immediately starts.
We’re on-call 24/7.
Week 12:
- Two minor bugs (fixed same day)
- Performance tuning (queries optimized)
- Team training (procurement team learns the new system)
Week 13-14:
- Further optimization
- Process refinement (users discover they can do things they couldn’t before)
- Capability expansion (new features they didn’t plan for, now possible)
By week 14: Platform is stable. Team is confident. Ready for handoff (or managed services).
The Results (3 Months Later)
Supply Chain Impact
| Metric | Before | After | Change |
|---|---|---|---|
| Inventory visibility delay | 4 hours | 8 seconds | 98% faster |
| Expedited shipments/year | 850 | 695 | -18% |
| Expedite cost/year | $2.1M | $1.4M | -$700K |
| Supply chain partner satisfaction | 7/10 | 9.5/10 | +35% |
| Just-in-time capability | Limited | Full | Enabled |
Financial Impact
| Item | Amount |
|---|---|
| Annual expedite savings | $700K |
| Labor productivity gain | $156K (eliminated manual workarounds) |
| Total year-1 benefit | $856K |
| Investment cost | $1.45M |
| Payback period | 17 months (conservative) |
| Year 2+ annual benefit | $856K-$2.1M (depending on growth) |
Board ROI: Payback achieved. Platform scaled. Ready for next phase.
The same failures happen in every migration we prevent.
Let’s make sure your platform transformation doesn’t repeat them.
Why This Worked (When Others Failed)
Failure Mode 1: Timeline Slip
Most vendors: “8-week estimate” → Discover legacy complexity → 16 weeks
We did: 10-week budget + pre-validated complexity + phase 2 caught issues
Result: 14 weeks, exactly.
Failure Mode 2: Hidden Technical Debt
Most vendors: Don’t discover the 4 manual workarounds → Go-live firefight
We did: Interviewed ops team + documented every workaround explicitly
Result: Zero surprises. Go-live smooth.
Failure Mode 3: Vendor Disappears at Go-Live
Most vendors: Deploy → Gone
We did: Stayed weeks 11-14, on-call 24/7, optimized against real load
Result: Stable platform by week 14.
Failure Mode 4: Cost Bleed
Most vendors: $2.5M bid → “Discovered complexity” → $2.8M final
We did: Locked $1.45M upfront, absorbed all complexity
Result: Final cost exactly $1.45M.
Failure Mode 5: Post-Go-Live Degradation
Most vendors: Stable day 3 → Slow day 7 (real load different from test)
We did: Real load testing weeks 12-14, tuned against production patterns
Result: Stable from day 1 of go-live.
The Framework They Should Have Used 4 Years Earlier
If they’d known this framework in year 0:
COST OF STAYING:
Supply chain visibility delay = $2.1M/year in expedites
Manual workarounds = $156K/year in labor
Lost scaling = $5M-$15M opportunity cost
TOTAL: $7.3M-$17.3M/year
COST OF FIXING:
Platform migration = $1.45M
Stabilization + training = Included
TOTAL: $1.45M
PAYBACK: 7 months
NET SAVINGS (3 years): $18.4M-$49.4M
They would have fixed it in year 0, not year 4.
What They’re Doing Now (Year 2)
Platform is stable. They’ve moved to managed services with ongoing platform optimization.
New initiatives:
- Adding a 3rd manufacturing facility (couldn’t do before)
- Integrating with new OEM partners (couldn’t do before)
- Predictive inventory optimization (wasn’t possible before)
- Supply chain visibility dashboard for customers (competitive advantage)
They went from “managing legacy constraints” to “enabling growth.”
Your Question
Do you have a legacy system silently costing you millions?
You probably know:
- Your inventory visibility delay
- Your expedite shipping costs
- Your manual workaround overhead
But you’ve never tied them together in a business case.
Let’s do that. In 30 minutes, we’ll calculate your specific cost and map the 14-week fix.
Then you can take that number to your board.
Ready to transform your platform like they did?
Book a 30-minute assessment. Pandiarajan reaches out within 24 hours.