When Three Systems Disagree, Revenue Forecasting Becomes a Debate Instead of a Decision

Abitha Jeyaraj, Marketing Executive
October 9, 2026 · 10 min read

In many leadership meetings we attend, revenue forecasting begins with a reconciliation rather than a decision. The sales leader brings a pipeline figure from the CRM. The operations leader brings an order figure from the ERP. Finance brings a billing and renewals figure from a third system. Each number is defensible, each is built carefully, and each tells a slightly different story. Before anyone can discuss what the business should do next quarter, the room spends its time debating which number to believe.
This pattern is remarkably common, and it is rarely caused by poor process. It happens because pipeline, orders and recurring revenue genuinely live in different systems, each optimised for its own team. To produce a single forecast, someone exports data from all three, adjusts for known gaps, applies judgement from last quarter and rebuilds the model by hand. The result is often last quarter’s number, carefully adjusted, presented with more confidence than its foundations support.
The consequences extend well beyond the finance function. When the forecast drifts, hiring plans, inventory commitments and cash planning drift with it. Leadership ends up planning around the number least likely to be wrong rather than the number most likely to be right. In this article, we share why revenue forecasting stays manual in organisations with capable systems, the framework we use to connect CRM, ERP and billing data into one revenue view, and how predictive analytics turns the forecast into a calculation the whole leadership team can work from.
The organisations getting sustained value from AI in forecasting all start with the same question: what is our data actually ready to support, and what needs to be connected first?
We have mapped that starting point across our enterprise AI and data programmes, and we will share the framework directly.
Why Forecasts Are Still Rebuilt by Hand Every Month
Most organisations we work with have invested in strong individual systems. Salesforce, Zoho or Microsoft Dynamics manages pipeline. SAP, Odoo or Dynamics manages orders and fulfilment. A billing or subscription platform manages invoices and renewals. Each system is accurate within its own domain. Revenue forecasting, however, needs all three domains at once, and none of these platforms was configured by default to share a common definition of revenue with the others.
Definitions are the first obstacle. Sales may count an opportunity as committed revenue at a particular stage. Operations recognises revenue when an order ships. Finance recognises it according to billing schedules and accounting rules. In our engineering reviews, we consistently find that a large share of forecast disagreement comes not from bad data but from three teams using the same word to mean three different things.
A forecast assembled from three disconnected systems carries the assumptions of whoever assembled it. When that person adjusts the numbers by judgement, the forecast becomes a reflection of experience rather than a calculation leadership can test.
Timing is the second obstacle. Manual revenue forecasting typically runs monthly, which means leadership plans against data that is weeks old by the time decisions are made. A large deal slipping, a renewal at risk or an order backlog building in one region may not appear in the forecast until the following cycle. By then, the hiring or inventory decisions that depended on the forecast have already been made.
Ownership is the third obstacle. Revenue forecasting usually belongs to finance, but the inputs belong to sales and operations. When the forecast misses, each function can reasonably point to data it did not control. Without a shared, governed data layer, nobody owns the forecast end to end, and improvement efforts stall in discussions about accountability. In our experience, the organisations that break this cycle treat revenue forecasting as a cross-functional capability with clear owners for each input, rather than a finance report that other teams contribute to once a month.
Where Each Revenue Signal Lives
Our approach begins by mapping every signal that contributes to revenue and the system where it lives. This revenue signal map shows leadership exactly which data feeds the forecast today, which data is missing, and where definitions diverge. It typically takes the first one to two weeks of discovery and frequently surfaces valuable signals that were never part of the forecast at all.
| Revenue Signal | Typical System | Role in a Connected Forecast |
|---|---|---|
| Open pipeline and stage | CRM | Probability-weighted future bookings |
| Historical win rates and cycle times | CRM history | Calibration for pipeline conversion |
| Confirmed orders and backlog | ERP | Near-term revenue with delivery timing |
| Invoices and payment patterns | Billing or finance platform | Recognised revenue and cash timing |
| Renewals and contract dates | Subscription or contract system | Recurring revenue and churn risk |
Seeing the signals side by side usually reframes the problem. Revenue forecasting is not a single model problem; it is a data connection problem first and a modelling problem second. Once the signals share definitions and refresh automatically, a forecasting model can do what spreadsheets cannot: weigh every open opportunity against real historical conversion, combine it with confirmed backlog and renewals, and update continuously as each source changes.
The Connected Revenue Framework We Use
We structure every revenue forecasting programme around a four-stage approach we call the Connected Revenue Framework. It follows the same principle as all our enterprise AI work: establish data readiness and governance first, then build models that the business can trust and explain.
- Align definitions: We bring sales, operations and finance together to agree a shared revenue vocabulary, including what counts as committed pipeline, booked revenue, recognised revenue and renewal risk. This single step often removes much of the existing forecast debate.
- Connect the data: We build data engineering pipelines that bring CRM, ERP and billing data into one governed revenue data layer, refreshed automatically and reconciled against each source system.
- Model and explain: We develop predictive models calibrated on your actual win rates, cycle times, order patterns and renewal history, with clear explanations of what drives each forecast movement so leaders can question and trust the output.
- Operationalise: We embed the forecast in leadership dashboards and planning rhythms, with MLOps practices that monitor accuracy, retrain models as patterns shift and flag when inputs change materially.
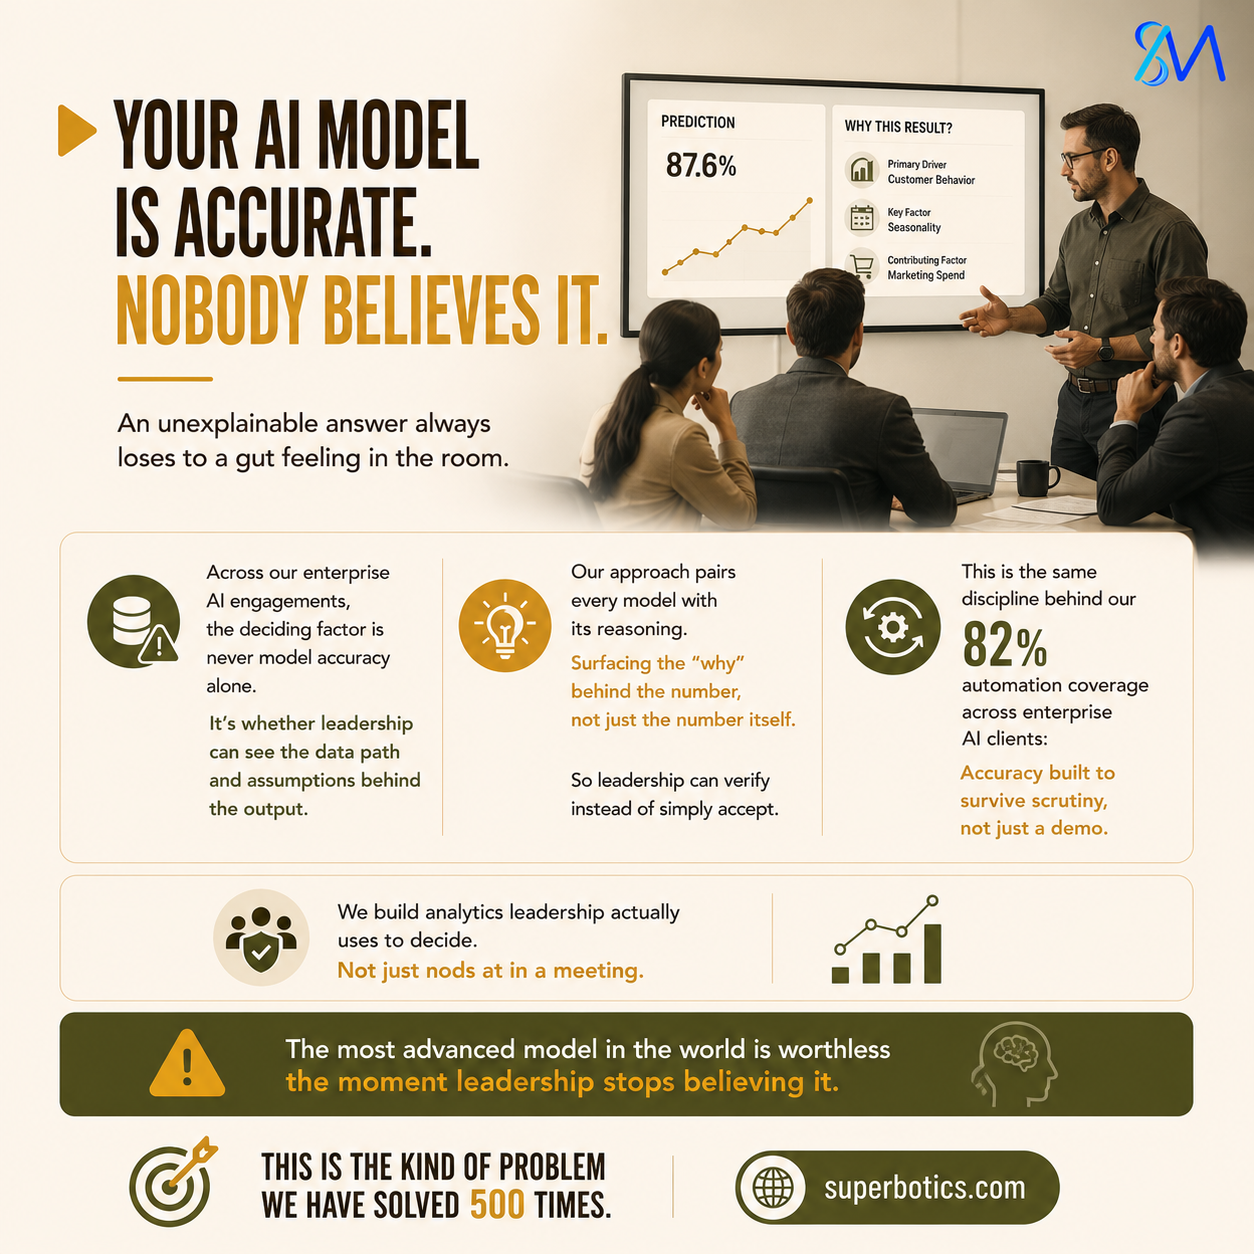
The Model and explain stage is where revenue forecasting earns leadership confidence. A forecast that cannot explain itself will be overridden by judgement at the first surprising result. We design every model so that a CFO can see why the forecast moved: which deals changed stage, which renewals shifted risk, which regions accelerated. Explainability turns the forecast from a number to accept into an analysis to discuss.
Governance runs through every stage. Responsible AI practices, data access controls and audit trails are built in from the outset, aligned with frameworks such as SOC 2 and GDPR where they apply. This matters particularly for revenue data, which is among the most sensitive information a business holds. Access to forecast inputs and outputs is role based, so each leader sees the level of detail appropriate to their responsibilities, and every model version is recorded so past forecasts can always be reproduced and reviewed.
From Debating the Number to Deciding What to Do
The clearest change after this work happens in the leadership meeting itself. Instead of reconciling three figures, the team reviews one forecast with a clear explanation of its drivers. The conversation moves from which number is right to what the business should do about it: where to add capacity, which deals need executive attention, which renewals need proactive outreach.
| Area | Manual Forecasting | Connected Revenue Forecasting |
|---|---|---|
| Data preparation | Exported and reconciled by hand monthly | Refreshed automatically from source systems |
| Forecast basis | Last quarter adjusted by judgement | Live pipeline, real order history and actual renewals |
| Explaining changes | Reconstructed after the fact | Drivers visible as the forecast moves |
| Planning cadence | Monthly, on ageing data | Continuous, with alerts on material shifts |
| Leadership meeting | Debating which number to trust | Deciding what to do with one trusted number |
Speed is a major part of the benefit. Our AI and data solutions deliver 4x faster insight cycles, which means leadership sees the effect of a slipping deal or an accelerating region far sooner than a monthly rebuild allows. Hiring, inventory and cash decisions can respond to the business as it is now rather than as it was several weeks ago.
Connected revenue forecasting also reduces the manual effort that surrounds every planning cycle. In AI-assisted operations work for a financial services client, we reduced manual review time by 45%. Across our enterprise AI programmes, we achieve 82% automation coverage on the workflows in scope. For revenue teams, that translates into analysts spending their time on interpretation and scenario planning rather than spreadsheet assembly.
Scenario planning becomes far more practical as well. When revenue forecasting runs on connected data and a calibrated model, leaders can ask what happens if win rates in one region fall by a few points, if a large renewal moves out by a quarter, or if backlog converts faster than usual. The model answers in minutes rather than days, and each scenario uses the same governed data as the base forecast. That consistency means boards and investors see scenarios grounded in the business’s real patterns, which strengthens confidence in every plan built on them. Revenue forecasting shifts from a single number defended once a month to a range of well-understood outcomes the leadership team can prepare for.
A Structured Path From Data to Production
Revenue forecasting programmes involve sensitive data and several stakeholder groups, so we follow a structured delivery path. Our enterprise AI programmes move from strategy and discovery to a production model in an average of 14 weeks. That timeline includes the definition workshop, data readiness assessment, pipeline engineering, model development and validation against historical periods, and deployment into leadership dashboards.
We work with the platforms best suited to each client’s environment, including OpenAI, Google Gemini, Azure AI, Anthropic Claude and Amazon Bedrock for AI capabilities, and LangChain or LlamaIndex where natural language interfaces help leaders query the forecast directly. On the data side, we connect to the CRM, ERP and billing platforms already in place, so the programme builds on existing investment.
Validation is a deliberate step. Before any forecast reaches leadership, we back-test the model against previous quarters and compare its accuracy with the manual forecasts produced at the time. This gives the leadership team evidence, not promises, about revenue forecasting accuracy and how much more reliable the connected approach is for their business.
What We Deliver for Revenue Planning
For CFOs, COOs and revenue leaders who want planning built on a forecast the whole leadership team trusts, we deliver data engineering and predictive analytics that turn revenue forecasting into a calculation. The engagement includes the revenue definition workshop, a revenue signal map, governed data pipelines connecting CRM, ERP and billing systems, explainable predictive models calibrated on your history, leadership dashboards, and MLOps monitoring to keep accuracy high as the business evolves.
The outcome is one revenue view calculated from live pipeline, real order history and actual renewals, delivered through a structured 14-week programme with governance embedded at every stage.
The right first question is not which AI tool to use. It is what our data and team need to be ready for forecasting to work.
That question, answered clearly, is worth more than any vendor comparison.
Planning With Confidence Starts With Connected Data
The leadership teams that plan with the most confidence are not forecasting harder or holding longer meetings. They are forecasting from connected data, with shared definitions and models they can interrogate. Revenue forecasting becomes a shared foundation for hiring, inventory and investment decisions rather than a monthly negotiation between functions.
We have built connected data and predictive analytics programmes for organisations across the US, UK, Europe, Brazil and Asia, and the pattern is consistent: once the data agrees, the conversation changes. Leaders spend their time on strategy, and the forecast becomes a tool rather than a topic.
Think back to last quarter’s forecast and ask whether anyone could explain exactly why it moved. The businesses that can answer that question clearly are the ones already planning the quarter after next.