When Leadership Doesn’t Trust Every Dashboard in the Room

Abitha Jeyaraj, Marketing Executive
August 24, 2026 · 4 min read

Two dashboards. Two numbers. One stalled decision. This is one of the most common moments we see inside leadership meetings across our enterprise engagements, and it rarely gets named as the actual problem. Someone reads a number out loud, half a second passes before anyone nods, and that half second carries the real cost. Nobody says they do not trust the figure. Nobody has to. Two people already keep a private version of the same report, just in case, and that habit became routine so long ago that nobody remembers deciding to build it.
Across 500 plus enterprise engagements, we consistently find that this is rarely a data quality problem. It is a lineage problem. When a number cannot be traced back to its source in seconds, trust erodes long before anyone admits it out loud in the room. Finance has one growth figure. Revenue Operations has another. Both are technically correct. Both are measuring from a different starting date, decided separately, months apart, by two people who never once compared notes.
500 plus operations leaders have taken the ERP Fit Quiz and found the real issue was not where they thought.
60 seconds. 10 questions. Your personalised next best action, no guesswork.
Why the same number never quite matches across teams
Most operational dashboards report plenty. What they rarely solve is the deeper issue underneath the reporting, numbers that never quite agree across departments because each dashboard pulls from a slightly different version of the truth. This is not usually the result of anyone acting in bad faith. It happens because dashboards get built incrementally, one department at a time, each connected to whichever data source was convenient at the moment it was built, with nobody responsible for reconciling the definitions across all of them.
The expensive part is never the wrong number itself. It is the hour spent afterward, by two or three people, quietly reconciling what should have agreed the first time anyone looked at it. Multiply that hour by every leadership meeting held across a year, and most organisations have never once done that math, because the cost never appears as a line item. It simply gets absorbed into whoever caught the discrepancy that week.
How SuperBotics builds dashboards leadership actually believes
Our data and BI engineering teams start every engagement by tracing where each dashboard’s numbers actually originate, department by department, before proposing any new tooling. From there, we build Business Intelligence systems where every dashboard traces to one verified source, not five exports stitched together the night before a meeting. This is architecture work, not a reporting layer bolted onto the existing confusion.
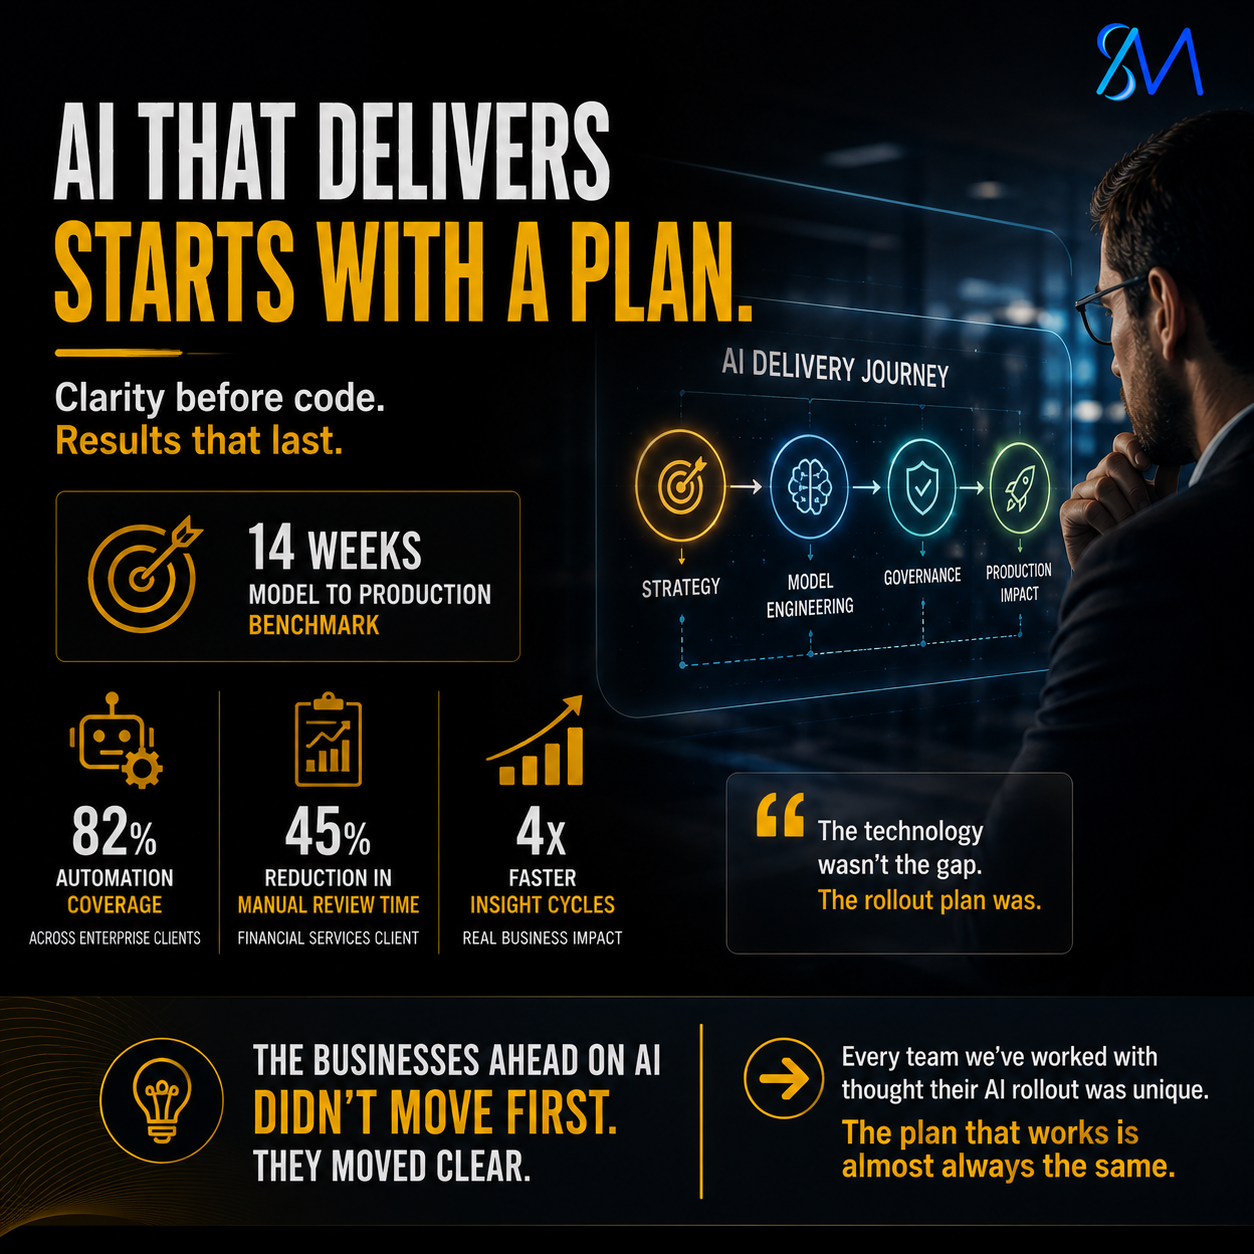
Our AI and data engineering work has helped clients reach 4x faster insight cycles, because the actual goal was never more dashboards. It was dashboards that leadership stops needing to double check before acting on them. That distinction, between a dashboard that reports data and one that a room fully trusts, is where most visibility investments either deliver measurable value or quietly become another tool nobody fully relies on.
The proof: what changes when every number traces to one source
Across our 500 plus enterprise engagements, the organisations making the fastest decisions share one common trait, a single data source that everyone in the room trusts before the meeting even starts. Clients working with us on Business Intelligence infrastructure have reached insight cycles up to 4x faster than their prior state, not because the underlying data changed, but because the path from raw data to the number on the screen became short enough and clear enough for leadership to act on immediately, without a validation pass first.
What SuperBotics specifically delivers for this problem
We give leadership teams one number that everyone in the room can act on immediately, built on dashboards where lineage is visible rather than assumed. That means connecting finance, operations, and leadership reporting to a single verified data architecture, defining clear ownership for each data source, and designing the BI layer around the decisions it needs to support rather than the volume of charts it can produce. Confidence in your data is not a reporting feature layered on afterward. It is the entire point of having a dashboard in the first place, and it is the standard every SuperBotics BI engagement is built against.
A dashboard nobody has to double check is worth more than ten dashboards nobody fully trusts.
See exactly where your systems stand, in the next 60 seconds.
The half second of hesitation is the signal worth acting on
Every organisation we have worked with initially assumed its dashboard mismatch was a one off, tied to a specific report or a specific quarter’s numbers. In practice, the pattern is structural and it is remarkably consistent across industries, dashboards built independently, definitions never reconciled, and a room full of capable people quietly keeping their own backup version just in case. Fixing the lineage, once, is what turns that half second of hesitation into a decision leadership can make on the spot.