When Two Dashboards Show Two Truths: Building a Single Source of Data Trust for Leadership Decisions

abitha
August 7, 2026 · 8 min read
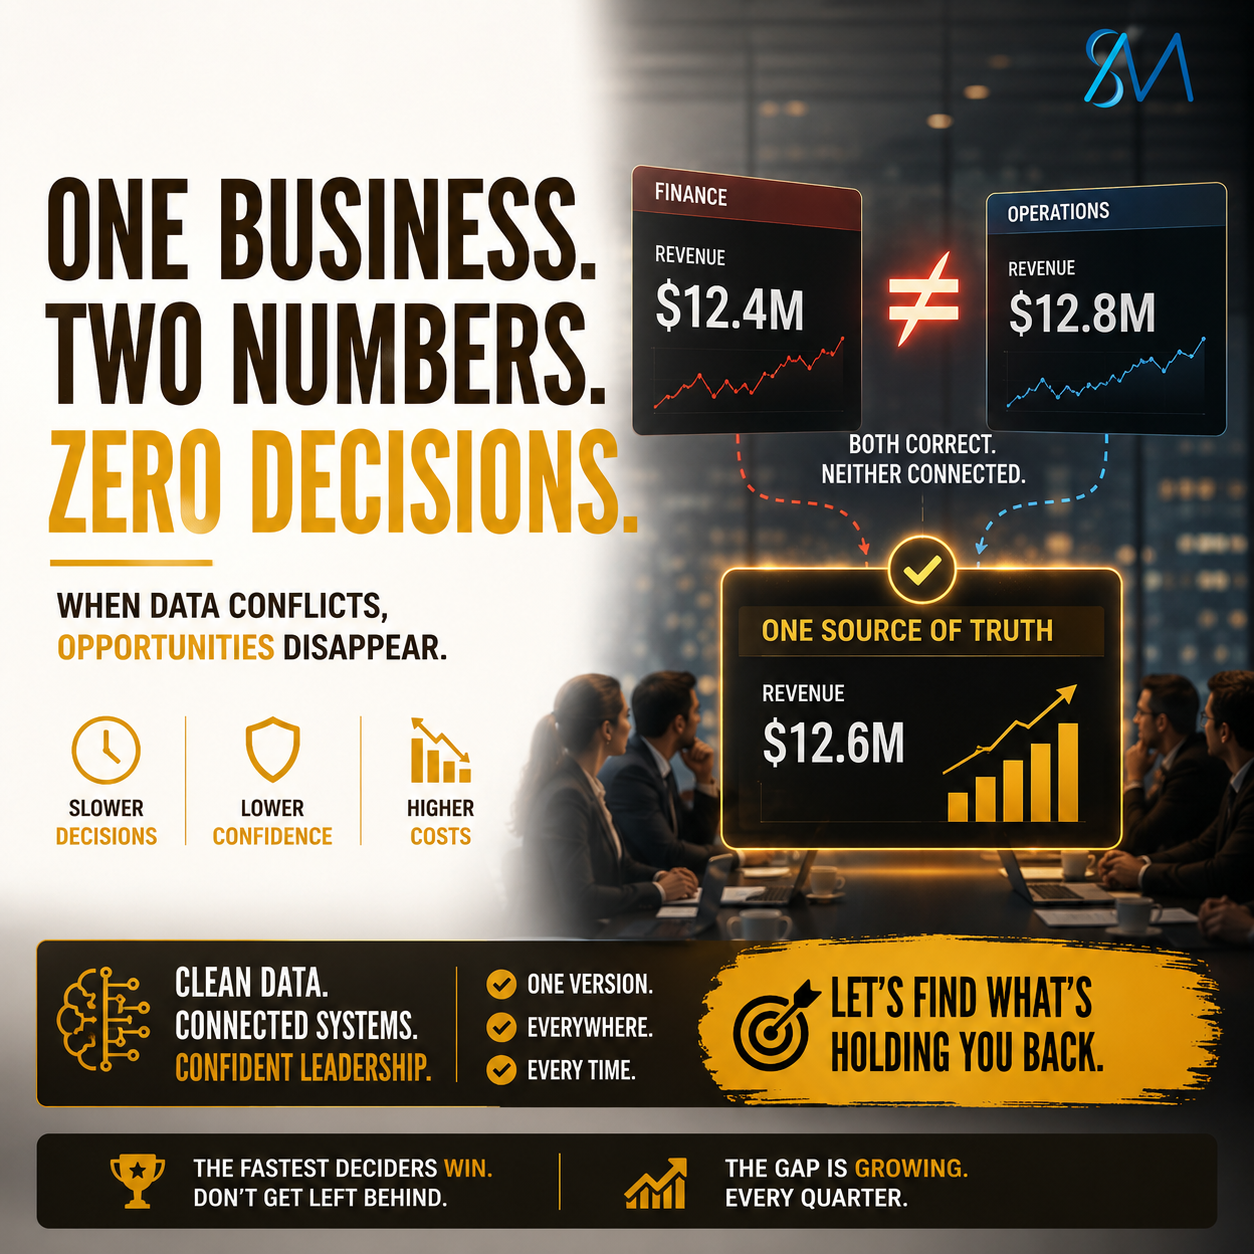
A number gets read aloud in a leadership meeting. Half a second passes before anyone nods. That half second is where the real cost lives. Nobody says the number looks wrong. Nobody has to. Finance is already running its own version of that figure in a separate spreadsheet, quietly, just in case, and Revenue Operations is doing the same thing from a different starting date that nobody ever compared against Finance’s.
This is not a data quality problem in the way most technology vendors describe it. The individual numbers are usually correct. Each department can defend exactly how it arrived at its figure. The problem is that two correct numbers, measured from two different starting points by two teams who never once compared notes, produce two different answers to the same business question, and a leadership team now has to spend the meeting deciding which correct answer to trust rather than deciding what to do about it.
Across the enterprise engagements we deliver, this pattern is one of the most expensive and least visible costs a growing organisation carries. It rarely shows up as a budget line. It shows up as a decision that sits pending confirmation for eleven days, not because anyone was confirming anything, but because nobody in the room was willing to say out loud that the dashboard might be wrong.
Why Data Trust Breaks Down Even Inside Disciplined Organisations
Organisations do not lose trust in their data because a team is careless. They lose it because the architecture underneath the data was never built to produce one shared answer in the first place. Finance, Operations, and Revenue teams each adopt platforms suited to their own function, each with its own definitions, its own refresh cadence, and its own assumptions about what counts as a closed deal, a completed shipment, or a recognised dollar of revenue.
None of those assumptions are wrong on their own. The trouble starts the moment two departments need to answer the same leadership question using data that was never designed to be compared. One team rounds a metric differently. Another logs an event a day earlier than the system of record technically allows. A third is still calculating against a rate that changed last quarter. None of these is a mistake in isolation. Together, they produce a boardroom where two correct numbers disagree, and where nobody can say with confidence which one reflects what actually happened in the business today.
In our engineering reviews, we consistently observe that this gap widens with growth, not with neglect. The faster an organisation scales, the more platforms get added, the more departments build their own reporting layer on top of systems that were never connected at the source, and the more expensive it becomes to reconcile every number a leadership team needs before it can act on any of them.
The pattern tends to follow a predictable path. A finance team adopts a platform built around accounting periods and recognised revenue. A revenue operations team adopts a separate platform built around pipeline stages and booked deals. Both are answering a version of the same question, how is the business performing, but neither platform was ever configured with the other’s definitions in mind. Six months later, a leadership review surfaces a growth figure from each team, both technically correct, both measuring from a different starting date decided separately by two people who never once compared notes. Nobody flags this as urgent because each number, viewed alone, looks entirely reasonable. It is only side by side, in the same meeting, that the gap becomes visible, and by then it has usually been quietly costing decision speed for months.
The organisations making the fastest decisions this year share one thing. A single data source that everyone in the room already trusts before the meeting starts, not one they have to negotiate during it.
How SuperBotics Builds a Single Source of Data Trust
Our approach to this problem starts with a discovery and data readiness assessment across every system that currently feeds a leadership decision. That includes the obvious systems of record, ERP, CRM, and finance platforms, but also the informal spreadsheets and exports that have quietly become a department’s real source of truth because nobody trusted the official dashboard enough to retire the workaround.
Once every source is mapped, we identify where definitions diverge across departments and resolve them at the architecture level, not in a meeting. That means establishing one authoritative definition per metric, one system of record per data type, and clean, validated connections between the platforms that need to share that data. This is enterprise integration work in its most literal sense, connecting the systems that hold finance, operations, and leadership data so that everyone in the room is looking at the same number, calculated the same way, from the same starting point.
We then layer responsible data governance on top of that connected architecture, so that when a definition needs to change, for example a shift in how revenue is recognised, it changes once at the source and propagates automatically everywhere that metric is used, rather than requiring every department to update its own spreadsheet independently and hope the changes stay in sync. This governance layer is what keeps two dashboards from drifting apart again six months after the initial integration work is done.
The outcome our clients consistently describe is not a new dashboard. It is the disappearance of the half second pause before a number gets acted on, because everyone in the room already knows where it came from and trusts that it is correct.
The gap is rarely where it first appears. Most operations leaders who take the ERP Fit Quiz find the real friction point is one layer deeper than where they have been looking.
See Where Your Operations Actually Stand, 2 Minutes
→ Speak with Our Team
The Proof: What a Trusted Data Architecture Changes in Practice
Across our AI and data engineering engagements, clients who move from fragmented dashboards to a single connected data architecture achieve 4x faster insight cycles, largely because the time previously spent reconciling conflicting numbers before a decision can be made is removed from the process entirely. One finserv client we partnered with reduced manual review time by 45% after we restructured how data moved between their operational and finance systems, because the review no longer needed to include a step where someone manually confirmed the number matched what another team had calculated separately.
These outcomes reflect a simple mechanism. Every minute a leadership team spends deciding which of two correct numbers to trust is a minute not spent deciding what to do about the number. Removing that reconciliation step does not just save time. It changes the speed at which an organisation can act on what its data is telling it, which compounds into a real competitive difference over a full quarter, not just a single meeting.
| Before Integration | After a Single Data Architecture |
|---|---|
| Two departments, two dashboards, two versions of the same metric | One authoritative definition per metric, shared across departments |
| Decisions delayed while numbers are reconciled in the meeting | Decisions made immediately because the number is already trusted |
| Manual cross checking absorbed quietly into team workload | Validation embedded in the data architecture, not in someone’s calendar |
What SuperBotics Specifically Delivers for Leadership Decision Confidence
For organisations facing this exact pattern, our Enterprise Integration engagements deliver a full architecture built around decision confidence rather than dashboard aesthetics. We connect the finance, operations, and CRM systems your leadership team already relies on, establish single ownership for every metric that crosses department lines, and build the governance layer that keeps definitions consistent as your business and your systems continue to evolve.
This work draws on the same delivery discipline behind our broader Enterprise AI Integration practice, where responsible governance is embedded at every stage of a 14 week average model to production timeline, and where 82% automation coverage has been achieved for clients who needed their data trusted enough to act on without a manual check first. The same principle applies whether the goal is an AI powered forecast or a Monday morning leadership meeting. Decisions only move at the speed of the trust behind the number.
We treat this as infrastructure work, not a reporting project, because the moment a single metric is allowed to drift back into two competing definitions, the trust problem returns even if the dashboards still look clean. That is why our engagements include a defined data ownership model as a deliverable in its own right, naming exactly which team owns each metric, which system is authoritative for it, and what happens procedurally the next time a definition needs to change. Clients across finance, operations, and revenue functions in the US, UK, France, Europe, and Brazil have used this model to retire the parallel spreadsheets their teams had quietly been keeping just in case, because the case for keeping them stopped existing once the shared source became something everyone could rely on without checking twice.
Where does your data architecture actually stand right now, department by department, dashboard by dashboard?
The ERP Fit Quiz surfaces that picture honestly, no interpretation required.
Every quarter that two departments keep operating on two versions of the truth, the decisions your competitors are making faster widen the gap a little further. The fix is rarely another dashboard layered on top of the confusion that already exists. It is a connected architecture underneath the dashboards, built once, that makes every number in the room something everyone can act on immediately.
The organisations winning the fastest decisions this year are not the ones with the most reporting tools. They are the ones where nobody has to pause before nodding.