Your Real Cost Per Order Is Hiding in the Steps Nobody Invoices

Abitha Jeyaraj, Marketing Executive
October 5, 2026 · 11 min read
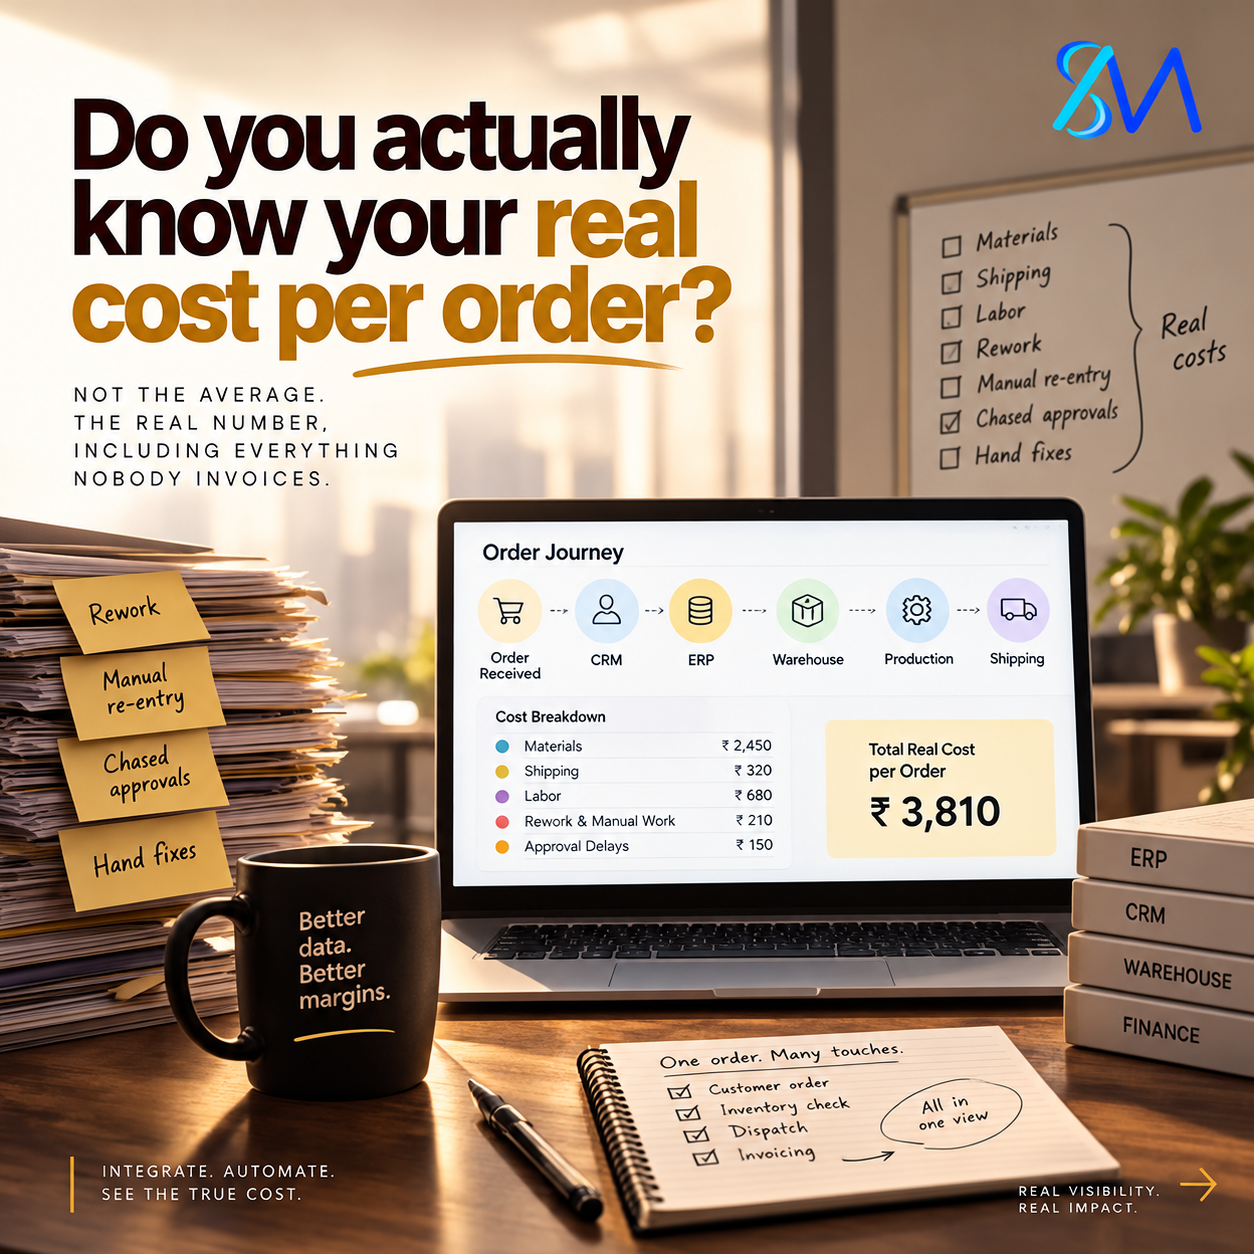
In nearly every operations review we run, the finance team and the operations team arrive with two different answers to the same question: what does it really cost us to fulfil one order? The finance number is clean and defensible, built from materials, freight and direct labour. The operations number is harder to state but deeply felt, because the people on the floor know how many times an order gets touched, corrected and chased before it ships. The real cost per order sits in the space between those two answers, and in our experience it is one of the most valuable numbers a leadership team can recover.
The gap exists because so much of the work around an order lives in people’s time rather than in a ledger. A sales coordinator re-keys an order from the CRM into the ERP. A planner calls the warehouse to confirm stock because the system figure is a day old. A manager approves a discount by email, and someone in finance reconciles it at month end. None of these steps carries an invoice, so none of them appears in the margin report, yet each one consumes paid hours and introduces a chance for error that leads to more paid hours later.
For a COO or CFO, this matters far beyond cost accounting. Pricing decisions, customer profitability rankings, channel strategy and capacity planning all rest on the cost per order figure. When that figure is cleaner than reality, the business can unknowingly favour its least profitable customers and underprice its most complex work. In this article, we share how we trace an order end to end, the framework we use to turn hidden effort into a measurable number, and how connecting ERP, CRM, warehouse and finance systems makes the real cost per order a calculation instead of an estimate.
Margin rarely slips away in one big leak. It moves one manual step at a time, usually in a handoff nobody has mapped.
The ERP Fit Quiz shows where your order flow carries the most hidden effort, in ten questions and sixty seconds.
→ See Where Your Operations Actually Stand in 2 Minutes
→ Speak with Our Team
Why the Standard Cost Model Looks Cleaner Than Reality
Standard costing was designed for a world where the main variables were materials, machine time and freight. Most ERP platforms, including SAP, Microsoft Dynamics and Odoo, model these inputs extremely well. What they were never configured to capture by default is coordination effort: the minutes spent moving information between systems that do not talk to each other. In our engineering reviews across 500+ successful projects, coordination effort is consistently the largest cost category that never appears on a report.
There is also a natural organisational reason the gap persists. Each manual step is owned by a different team, and each team sees only its own slice. Sales sees the time spent entering orders. The warehouse sees the time spent picking corrections. Finance sees the time spent on reconciliations. Nobody sees the full journey of a single order, so nobody can add up its full cost or state the real cost per order with confidence. The real cost per order is not hidden by any one function; it is distributed across all of them.
A cost per order figure that excludes manual handling is not wrong, it is incomplete. Every pricing, discounting and customer profitability decision built on it inherits that incompleteness quietly.
The third factor is volume. A single re-keyed order costs a few minutes. Multiplied across thousands of orders a month and several touches per order, those minutes become a significant share of operating expense. Because the cost is spread thinly and evenly, it rarely triggers the attention a single large expense would. For the real cost per order, this is the decisive factor. We often describe it to clients as the most predictable cost in the business that nobody has yet measured.
Tracing One Order From Quote to Cash
Our approach begins with a deliberately simple exercise. We select a representative order and follow it from the first customer enquiry to final cash collection, recording every system it passes through, every person who touches it and every point where information is copied, checked or corrected. This order journey map is usually completed within the first week of discovery, and it changes the conversation about the real cost per order almost immediately.
| Order Stage | Typical Hidden Touch | What It Costs | Connected Alternative |
|---|---|---|---|
| Quote to order | Re-keying CRM quote into ERP | Entry time plus transcription errors | CRM opportunity converts to ERP sales order through API |
| Order to stock check | Phone or email to confirm availability | Planner and warehouse time | Live available to promise visible in CRM |
| Pricing exceptions | Discount approved by email | Manager time and month end reconciliation | Approval workflow inside ERP with audit trail |
| Pick and dispatch | Manual correction of pick lists | Rework and occasional reshipment | Warehouse system reads the confirmed order directly |
| Invoice to cash | Matching invoice to changed order | Finance reconciliation effort | Invoice generated from the final fulfilled order record |
When leadership sees the journey laid out like this, two insights tend to emerge together. First, the number of touches behind the real cost per order is almost always higher than anyone expected, often double the figure people estimate before the exercise. Second, the touches cluster around a small number of handoffs between systems. That clustering is good news, because it means a focused integration scope can remove a large share of the hidden effort without rebuilding the entire order process.
We then attach a time and cost estimate to each touch, working alongside the people who perform them. This produces a first version of the real cost per order that both finance and operations recognise as accurate. In our experience, this shared number does more to align the two functions than any amount of reporting, because it is built from the actual work rather than from assumptions about it.
The Order Touch Framework We Use
Once the journey is mapped, we follow a four-stage method we call the Order Touch Framework. It is designed to remove manual steps in the order that delivers the most value first, while building the reporting that makes the real cost per order visible permanently rather than as a one-time study.
- Map: We complete the order journey for each major order type, including standard, custom and exception orders, and record every touch with its owner, system and estimated time. The output is a touch inventory that finance and operations both sign off.
- Rank: We rank each touch by frequency, effort and error risk, then group them by the system handoff that causes them. This shows which two or three integrations will remove the most hidden cost.
- Connect: We integrate the ranked handoffs through API orchestration across your ERP, CRM, warehouse and finance platforms, so information moves once and stays consistent. Manual steps are replaced by structured workflows with approval trails where governance requires them.
- Measure: We build a cost per order report that draws directly from the connected systems, including remaining manual touches, so leadership sees the true number every month and can watch it improve.
Making the real cost per order permanent is the purpose of the final stage. The Measure stage is what turns a project into a lasting capability. Many organisations have run cost studies before, and most of those studies faded because the number had to be rebuilt by hand. When the real cost per order is calculated from connected system data, it becomes a living operational metric that informs pricing reviews, customer conversations and investment decisions every month.
Throughout the programme, we stay disciplined about scope. Our goal is not to automate everything. Some touches exist for good reasons, such as a credit check on a new customer or a quality sign off on a custom build. The framework keeps those deliberate controls in place and removes only the touches that exist because systems are disconnected.
What Changes When Finance and Operations Share One Number
The most visible change after this work is cultural as much as technical. Finance and operations stop debating whose cost figure is right and start discussing what to do about it. Pricing teams can see which order types carry the heaviest handling load and the highest real cost per order. Sales leaders can see which customers generate the most exceptions. Operations leaders can make a clear case for process investment backed by numbers both sides trust.
| Decision Area | Built on Standard Cost | Built on Real Cost Per Order |
|---|---|---|
| Pricing | Margin assumed uniform across order types | Complex and exception orders priced to reflect true effort |
| Customer profitability | Ranked by revenue and gross margin | Ranked by margin after handling and rework |
| Process investment | Justified by general efficiency goals | Justified by measured hours removed per order |
| Capacity planning | Headcount added as volume grows | Volume absorbed by removing manual touches first |
This shift also changes how growth feels inside the business. When manual touches remain, every increase in order volume requires a proportional increase in coordination effort and often in headcount. When the handoffs are connected, the same team can handle significantly more volume, because the incremental order carries far fewer manual steps. The real cost per order falls as the business grows, which is exactly the relationship a scaling organisation wants.
Delivery Built for Speed and Confidence
Order flow touches nearly every function, so we deliver this work through cross-functional engineering pods that combine integration engineers, a business analyst and QA from the first week. Pods are onboarded and delivering within 10 business days, which means discovery and the first order journey map can begin almost immediately after agreement. Our delivery follows a structured sequence: discovery and calibration in week zero, integration and launch in weeks one and two, and continuous delivery and optimisation from week three onward.
Each integration release goes live with a defined measure tied to the real cost per order, such as touches removed per order or the share of orders flowing from CRM to ERP without manual entry. This keeps the programme grounded in outcomes rather than activity. Our 98% on-time release rate reflects that discipline, and our average client partnership tenure of 6.8 years reflects how often the first cost per order programme becomes the foundation for broader operational work.
We work across the platforms most operations teams already run, including SAP, Microsoft Dynamics, Odoo, Zoho and Salesforce, so the programme improves your existing investment rather than replacing it. With 120+ specialists available on demand, we can bring in platform specific expertise for each handoff without slowing the core pod.
What We Deliver to Make the Real Cost Visible
For operations and finance leaders who want pricing and margin decisions built on the true figure, we deliver an integration and automation programme that turns the real cost per order from an estimate into a calculation. The engagement includes the order journey mapping workshop, a signed off touch inventory, ranked integration priorities, API orchestration across ERP, CRM, warehouse and finance systems, approval workflows where controls are needed, and a cost per order report drawn directly from connected data.
The outcome is a business where every order moves through fewer hands, finance and operations work from the same number, and every pricing or customer decision reflects what the work actually costs. That clarity compounds month after month, because each manual step removed is a saving that repeats on every order that follows.
The clearest starting point we have seen: know what your operations are actually ready for before deciding what to change.
The ERP Fit Quiz surfaces that picture honestly, with no interpretation required.
The Number Worth Knowing Before the Next Pricing Review
Every growing business that studies its real cost per order eventually asks whether its most valuable customers are also its most profitable ones. The answer depends entirely on whether the cost per order includes the work that happens between systems. When it does, leadership can price with confidence, invest in the right processes and scale without adding coordination effort at the same rate as revenue.
We have traced order journeys across manufacturing, distribution, retail and B2B services, and the pattern holds consistently: the hidden effort clusters in a few handoffs, and connecting those handoffs changes both the cost and the conversation. The real cost per order becomes a number the whole leadership team can rely on, not a figure each function defends.
Your margin is already telling you a story through every manual step your team takes. The organisations that grow most profitably are simply the ones that learned to read it, one order at a time.